Debugging JavaScript in Chrome DevTools
Dustin Miner
- posted on
- Comments Off on Debugging JavaScript in Chrome DevTools
Introduction
A Dynamics 365 developer typically spends quite a bit of time extending the Dynamics 365 UI by leveraging JavaScript. Thus, it’s handy to have at least a basic understanding of how to use Chrome’s JavaScript debugging tools.
The following example provides a quick overview of some of the basic debugging features that Chrome DevTools offers.
In Detail
Example
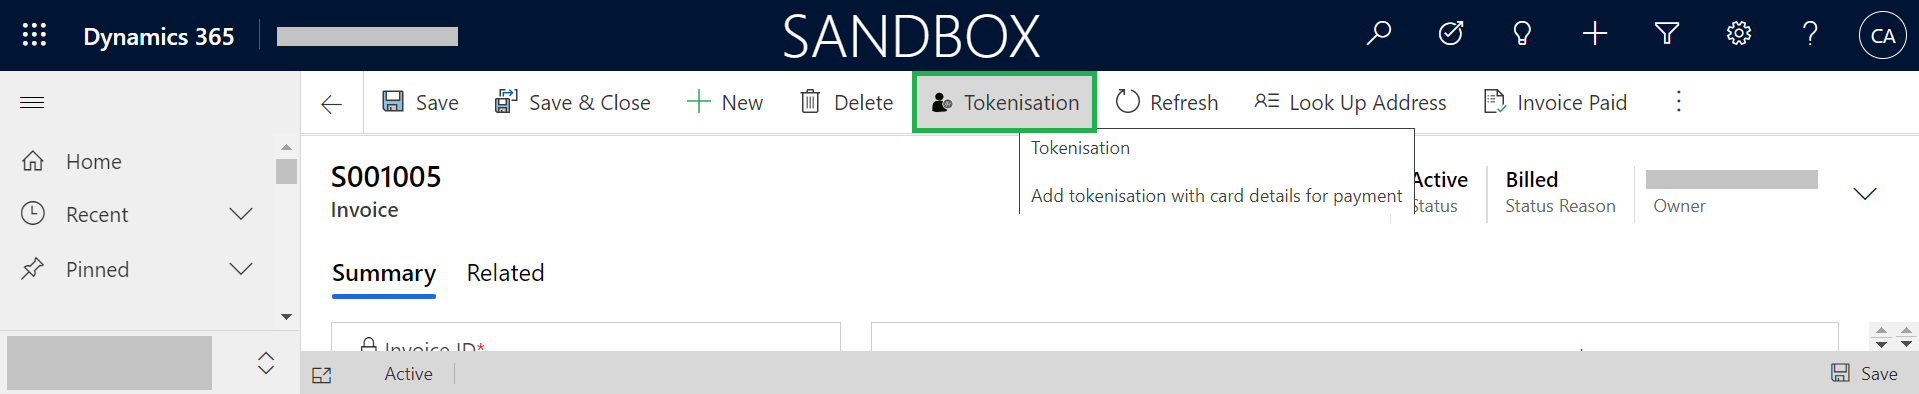
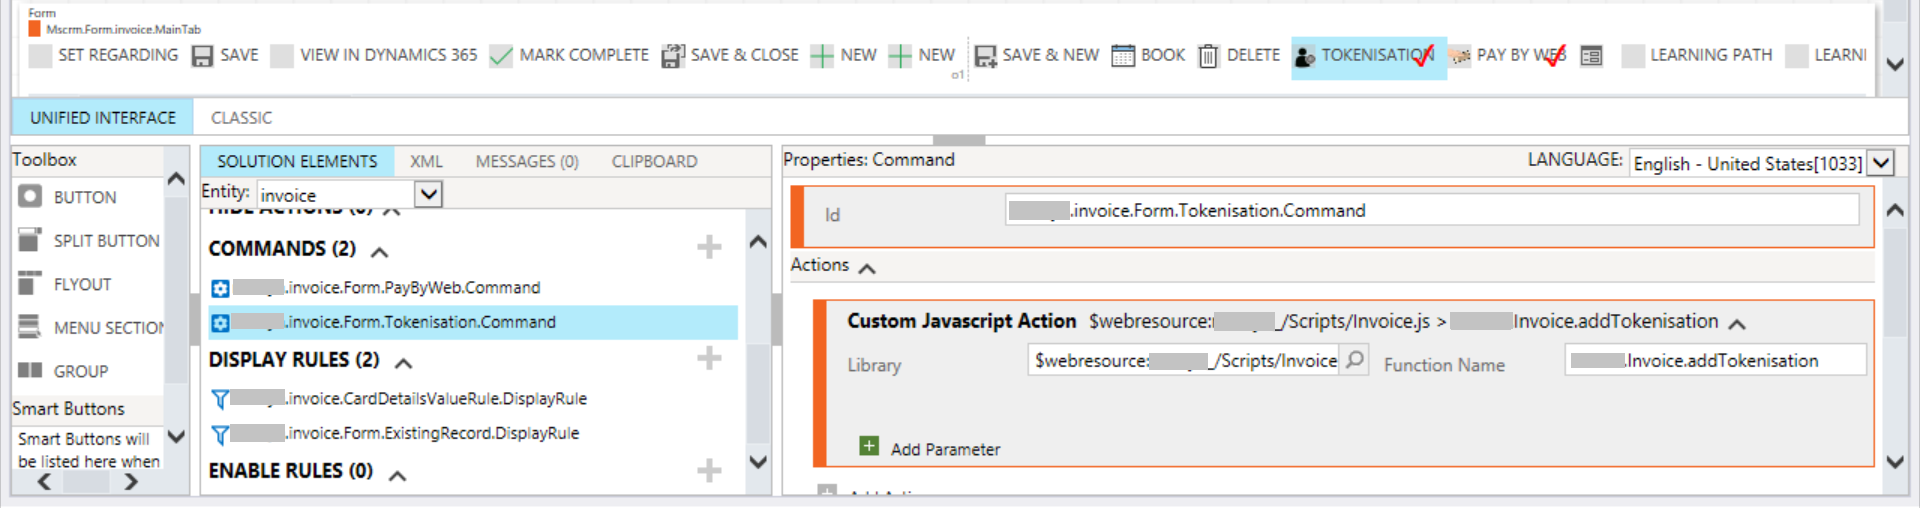
This example illustrates the debugging of the JavaScript file Invoice.js which is called by the ‘Tokenisation’ ribbon button.
To debug the JavaScript, Chrome DevTools provides the ability to open the JavaScript file Invoice.js (Figure 3).
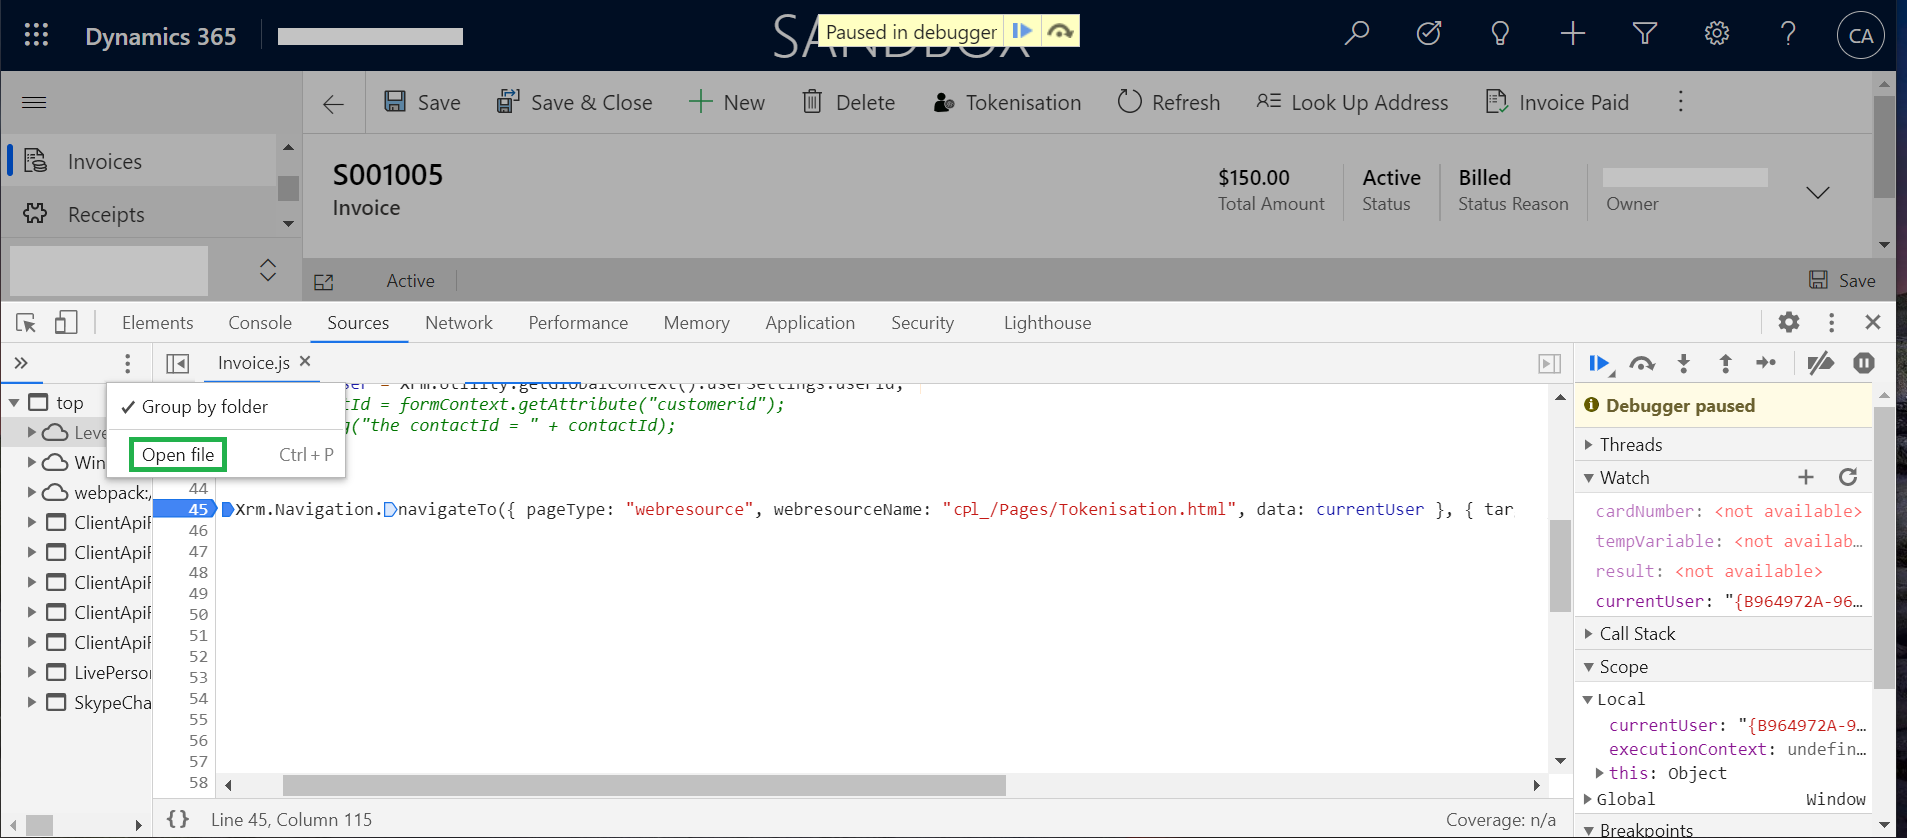
Within this file, a call is made to the Dynamics 365 client API Xrm.Navigation.navigateTo. This call:
- Navigates to a html file which allows users to enter their credit card details.
- Generates a query string which includes the current user’s GUID as part of this call. The tab ‘Network’ displays the query string (highlighted in Figure 4).
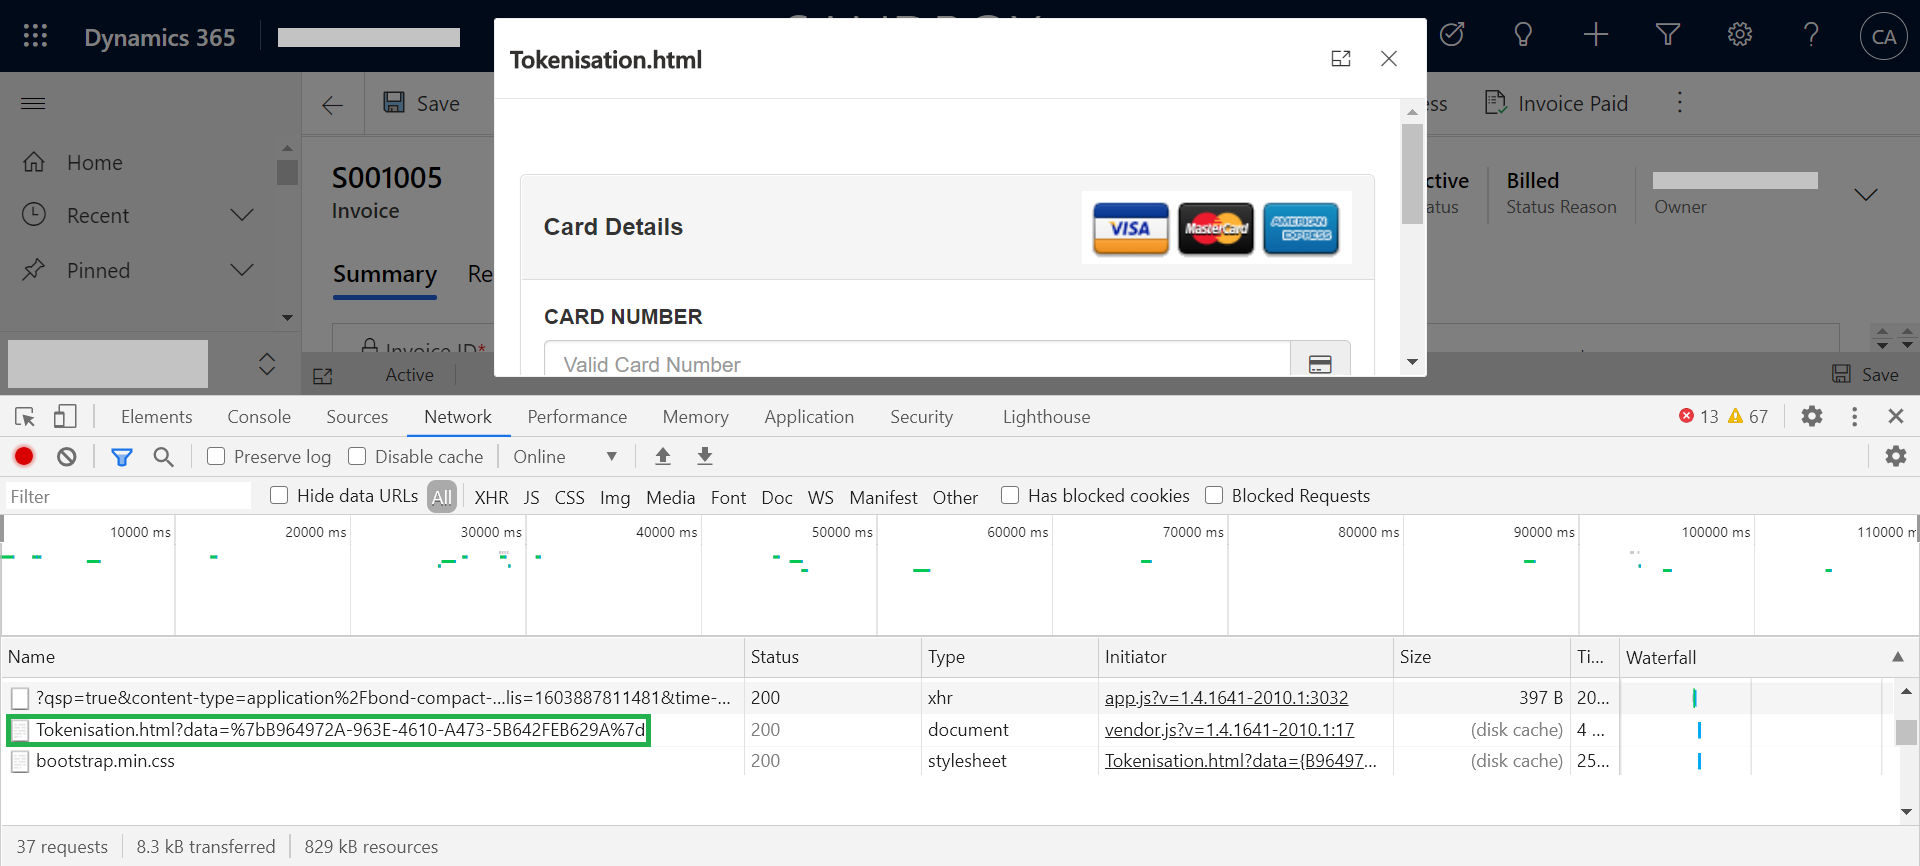
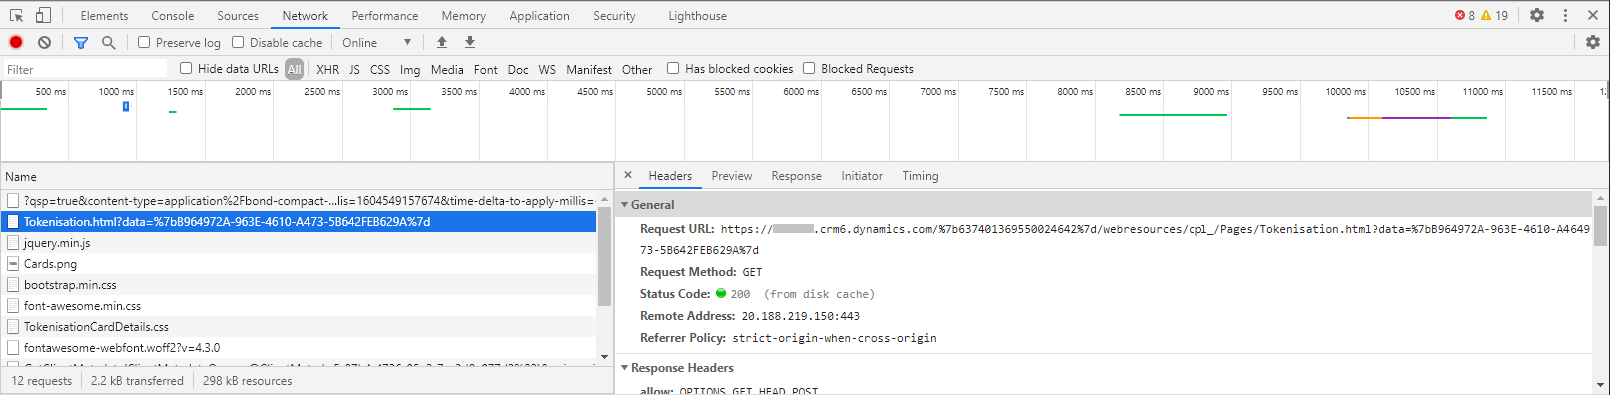
To see the detail, the highlighted link in Figure 4 can be clicked on. (Note: typing window.location in the console window will also display these details.)
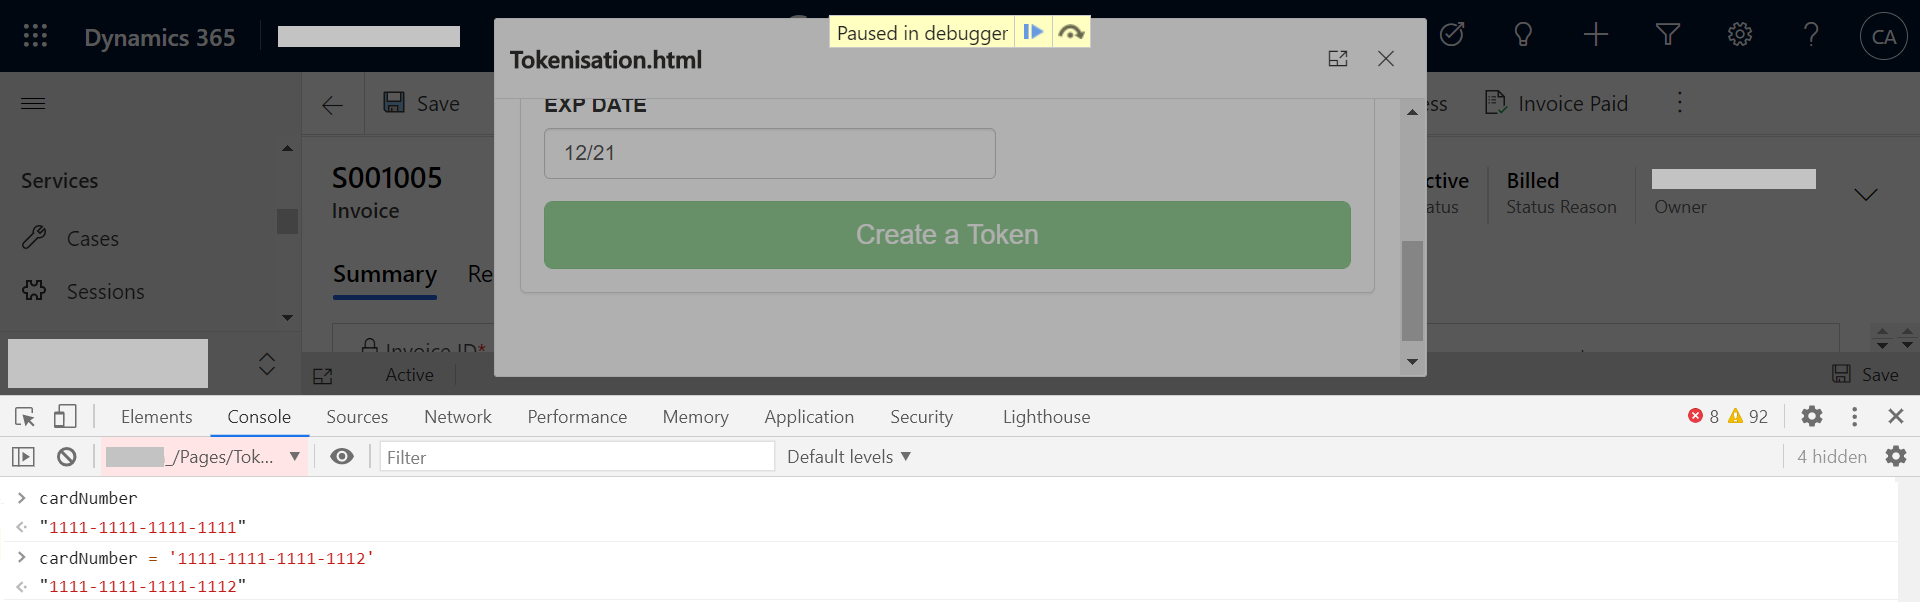
Finally, the ‘Console’ tab allows the developer retrieve the card number by typing ‘document.getElementsByName(‘cardNumber’);’ It can also be used to alter the credit card details that were added in the popup.
(Note: JavaScript code, such as code to call a Web API can be pasted and executed here.)